Data Comparison
Benchmarking the actual data on solar plant design and performance against theoretical values and published statistics

Published and calculated data on power generation
We analyse the data given for each of the projects in the Wiki-Solar Database to give the key parameters described here. This therefore reflects the ratios achieved in practice.
Comparable data
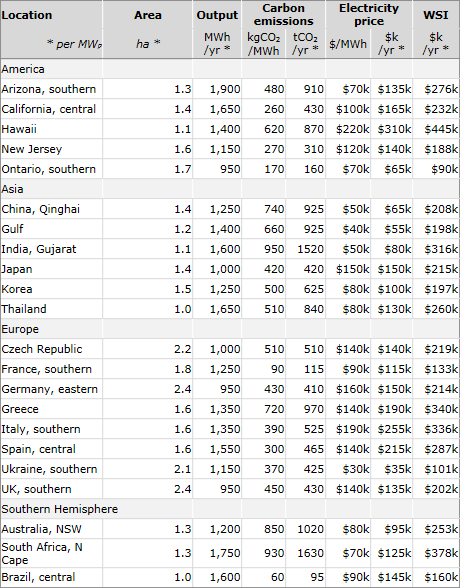
Several of these ratios can be calculated in theory or from national published data, and some sample results derived in this way are illustrated on the right.
A key to the figures in each column is given on the far right.
Sources of data
Columns headed with an asterisk show ratios per MWp of solar generation capacity.
The data in each column is derived as follows:
- Locations show geographic area where the solar radiation data used in columns 2 and 3 has been selected. Other statistics (from column 4 below) apply to the relevant state or country
- Site area per MWp of capacity calculated based on the latitude of the site and the spacing required to minimise shading between arrays
- Annual output per MWp based on standard solar radiation figures from the EU, NREL and similar sources°
- Average carbon emissions of electricity
- Emissions saved / MWp based on published data from International Energy Agency and other sources°
- Average electricity price based on published data from International Energy Agency and other sources°
- Electricity value / MWp based on national and regional published data°
- Wiki-Solar Index; a synthesised calculation of the gross value per MWp per year, by combining the value of electricity with that of carbon savings at $155/tCO2
° There is a full list of data sources in the book
This analysis excludes the benefits that may accrue from incentive and support programs, such as those listed here.
@WikiSolar | Standard | Copyright © WolfeWare Ltd |